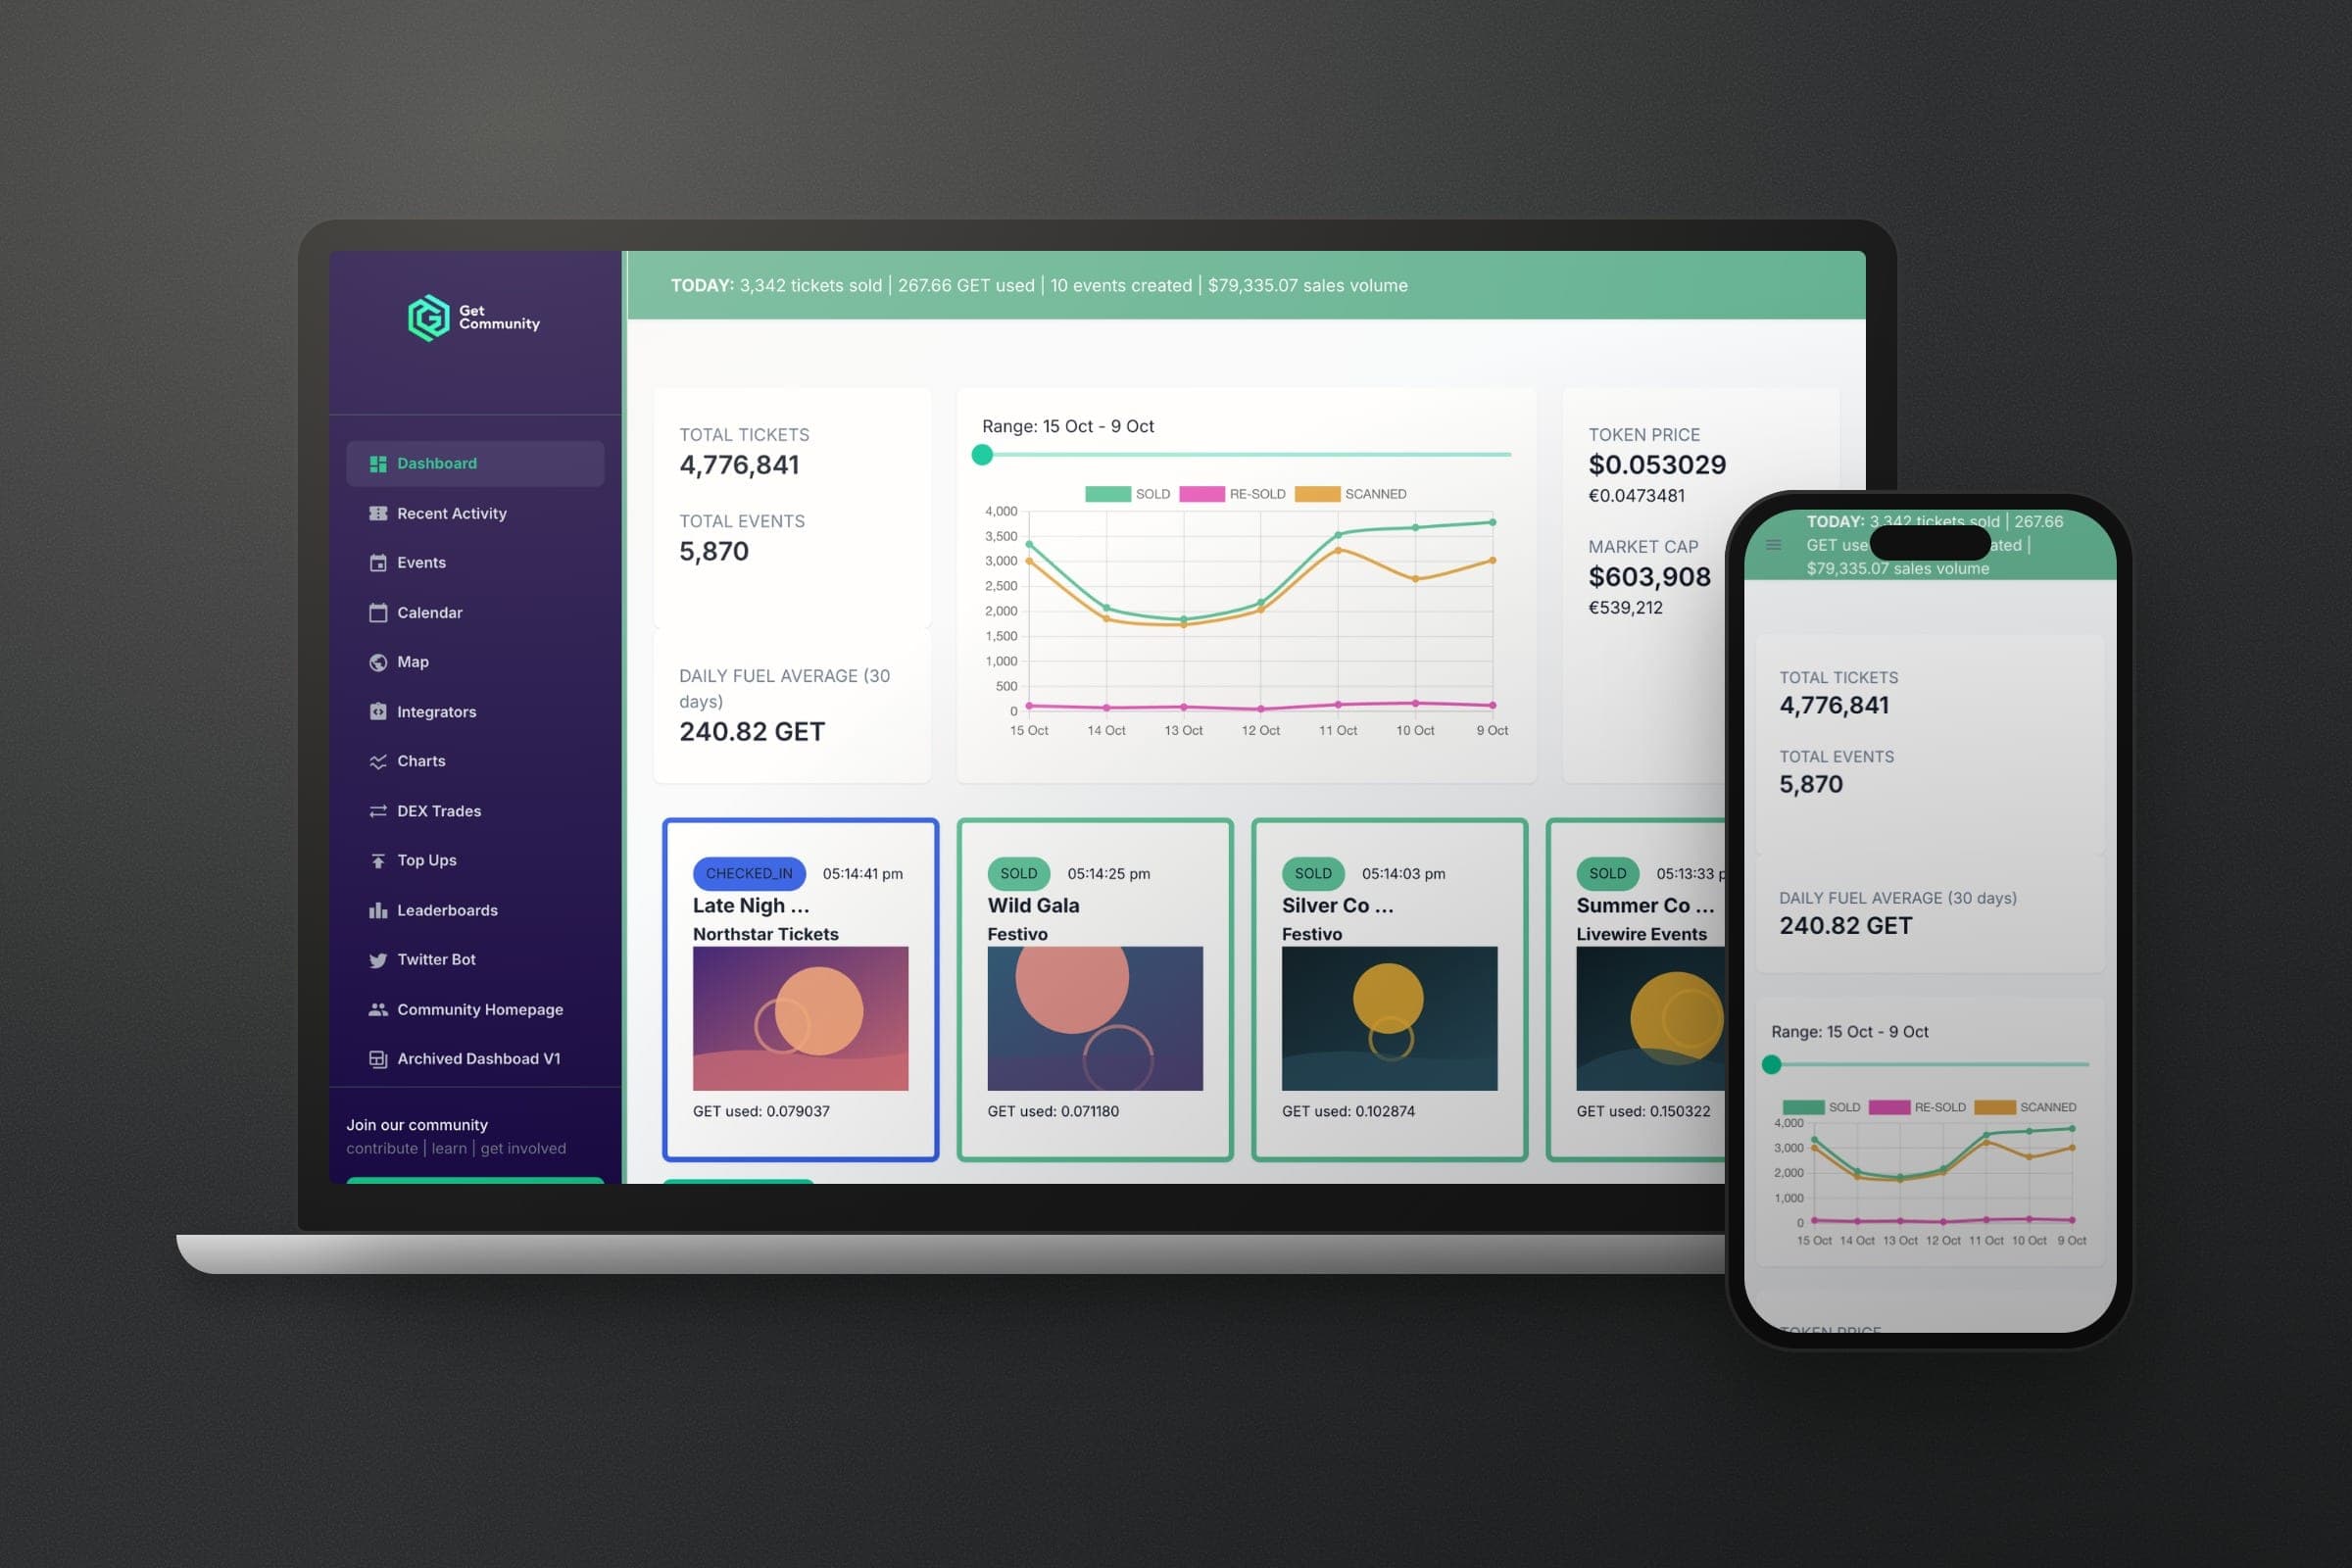
GET Protocol Community Dashboard
- GET Protocol community
- Web
- Design and build
- Link
- View the code
A live dashboard for the GET Protocol community: ticket sales, fuel usage and events on the blockchain, readable at a glance and updating as it happens.
GET Protocol puts event tickets on the blockchain. Every sale, resale, scan and check-in is recorded on Polygon, and each ticket uses a little of the GET token as fuel. All of it is public, but raw. I built the community dashboard to make it readable: what sold today, how much GET was used, and which events and ticketing companies are busiest, live as it happens.
A small Node server reads the protocol's subgraph and pushes updates to every open dashboard over a WebSocket once a minute, so the numbers move without a refresh. The dashboard itself, in Next.js and Material UI, has a live activity feed filterable by type, a searchable events directory, a calendar and map of upcoming events, a profile and fuel chart for each ticketing company, top-up history and leaderboards for the busiest days and events. The code is open source, with contributions from the community.
The live data feed it read from is no longer available, so the screenshots here show the dashboard running locally on sample data in the same shape. The ticketing companies, events and figures are illustrative, not GET Protocol's real numbers.